
Category:English-language charts
Subcategories
This category has the following 13 subcategories, out of 13 total.
*
B
C
E
F
G
S
Media in category "English-language charts"
The following 200 files are in this category, out of 1,598 total.
(previous page) (next page)-
.png/120px-%22Il_Messaggero%22_-_diffusione_media_del_quotidiano_-_avarage_daily_newspaper_circulation_(1976-).png)
-
.png/120px-%22La_Repubblica%22_-_diffusione_media_del_quotidiano_-_avarage_daily_newspaper_circulation_(1976-).png)
-
_Term_by_Tom_Bell.png/120px-(C)_Term_by_Tom_Bell.png) (C) Term by Tom Bell.png 545 × 334; 3 KB
(C) Term by Tom Bell.png 545 × 334; 3 KB
-
 01 Path.png 640 × 480; 21 KB
-
 02 Horiz vel.png 640 × 480; 22 KB
-
 03 Vert vel.png 640 × 480; 23 KB
-
 05 SPSS Faktoriális Anova kontrollcsoportterves eredmény.jpg 609 × 280; 76 KB
-

-

-
 1 314382358l.jpg 600 × 337; 32 KB
-

-
 1 asia.png 813 × 471; 541 KB
-
 1 rcuhmTxoiA1KRJQzBKJpAw.webp 1,174 × 312; 14 KB
-
.jpg/120px-1%2C000%2C000_flickr_views_(5703416551).jpg) 1,000,000 flickr views (5703416551).jpg 1,030 × 610; 103 KB
1,000,000 flickr views (5703416551).jpg 1,030 × 610; 103 KB
-
 1-chart.png 975 × 634; 289 KB
-
 1-s2.0-S1359029422001145-gr2 lrg.jpg 2,625 × 2,716; 971 KB
-
 10 YR Electric Energy Generation 2005-2015.jpg 476 × 431; 46 KB
-
 10 YR Profile of Renewables Electric Energy Generation in US.png 507 × 338; 15 KB
-
 10 yr Profile of Wind Generated Electric Energy.jpg 480 × 289; 30 KB
-
 10 Yr Profile of Wind Generated Electric Energy.jpg 484 × 289; 36 KB
-
 10.electroless.nickel.jpg 755 × 394; 37 KB
-
 100% Solar is cost effective in sunniest cities.png 2,000 × 1,960; 429 KB
-
.jpg/120px-16003073_1600705783289180_4874338460021530374_n_(35927501153).jpg) 16003073 1600705783289180 4874338460021530374 n (35927501153).jpg 960 × 960; 80 KB
16003073 1600705783289180 4874338460021530374 n (35927501153).jpg 960 × 960; 80 KB
-
 1930-33grainUSSRandUkrSRRgraincollection.jpg 1,253 × 603; 48 KB
-
 1998-2005 German-production-of-coal-mine-methane.jpg 802 × 399; 122 KB
-
 1D Photonic Crystal.png 1,318 × 1,111; 16 KB
-
 2 Models Graph.jpg 755 × 547; 82 KB
-
 2 Species.tif 960 × 720; 53 KB
-
 2 USGA ANWR Oil.png 1,053 × 767; 78 KB
-
 2"TIME TO WATCH THE WATCHERS"jpg.jpg 5,196 × 2,490; 322 KB
-
 2000 Year Temperature Comparison.png 1,449 × 1,088; 341 KB
-
 2002-2013 Alcohol Use among Persons Aged 12 to 20, by Age - United States.png 2,255 × 1,420; 604 KB
-
 2004-2014 Renewable Electric Energy profile.png 528 × 355; 15 KB
-

-

-

-
 2012 Ukraine Population Pyramid.jpg 1,000 × 727; 222 KB
-
 2014 Geo Thermal Electric Energy Generation Profile.png 504 × 342; 10 KB
-
 2014 Solar PV Electric Energy Generation Profile.png 504 × 342; 11 KB
-
 2014 Solar Thermal Electric Energy Generation Profile.png 504 × 342; 11 KB
-
 2014 Wind Electric Energy Generation Profile.png 504 × 342; 11 KB
-
 2015 Geothermal Electric Energy Generation Profile.png 507 × 338; 11 KB
-
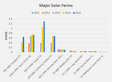 2015 Major Solar Farms.png 507 × 348; 16 KB
-
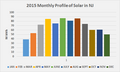
 2015 Monthly Profile of Solar Energy for NV.png 481 × 289; 13 KB
-
 2015 Monthly Profile of Solar for NJ.png 481 × 289; 13 KB
-
 2015 Monthly Solar Profile for AZ.png 481 × 289; 13 KB
-
 2015 Other Biomass Electric Energy Generation Profile.png 507 × 338; 12 KB
-
 2015 Profile for Solar Thermal generated Electric Energy.jpg 480 × 289; 31 KB
-
 2015 Profile of Solar PV Generated Electric Energy.jpg 480 × 289; 32 KB
-
 2015 Renewable Electric Energy Generation.png 481 × 288; 13 KB
-
 2015 Solar projects Capacity Factors.png 472 × 324; 15 KB
-
 2015 Solar PV Electric Energy Generation Profile.png 507 × 338; 12 KB
-
 2015 Solar Thermal Electric Energy Generation Profile.png 507 × 338; 11 KB
-
 2015 Top Five Hydro States.png 481 × 288; 8 KB
-
 2015 Top Five Solar States.png 480 × 288; 6 KB
-
 2015 Top Five States for Renewable Electric Energy.png 481 × 288; 7 KB
-
 2015 Top Five Wind States.png 481 × 288; 9 KB
-
 2015 US Electric Energy Generation Profile.png 507 × 338; 11 KB
-
 2015 US Renewables Pie Chart.png 363 × 338; 13 KB
-
 2015 Wind Electric Energy Generation Profile.png 507 × 338; 11 KB
-
 2015 Wood Electric Energy Generation Profile.png 507 × 338; 12 KB
-
 2015-2019 Capacity Projections.png 507 × 338; 11 KB
-
 2016 Electric Customers.jpg 576 × 324; 33 KB
-
 2016 Profile of Renewable Electric Energy.jpg 480 × 289; 41 KB
-
 2016 Profile of US Electric Energy Produced by Solar PV.jpg 480 × 289; 31 KB
-
 2016 Profile of US Electric Energy Produced by Solar Thermal.jpg 480 × 289; 37 KB
-
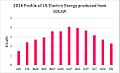 2016 Profile of US Electric Energy produced by SOLAR.jpg 481 × 296; 32 KB
-
 2016 Top Five States for Distributed Solar.jpg 480 × 301; 22 KB
-
 2016 Top Five States for Renewable Electric Energy.png 480 × 289; 7 KB
-
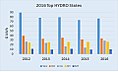 2016 Top HYDRO States.jpg 480 × 289; 31 KB
-
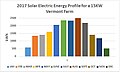 2017 15KW Vermont Farm Solar Energy Generation Profile.jpg 484 × 289; 31 KB
-
 2017 AZ Solar Eneregy Generation Profile.jpg 484 × 289; 32 KB
-
 2017 CA Solar Energy Generation Profile.jpg 484 × 289; 32 KB
-
 2017 Electric Generation by State by Fuel Source.jpg 1,001 × 532; 156 KB
-
 2017 Median income graph by ethnicity.png 800 × 540; 76 KB
-
 2017 NC Solar Energy Generation Profile.jpg 484 × 288; 34 KB
-
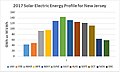 2017 NJ Solar Energy Generation Profile.jpg 484 × 289; 34 KB
-
 2017 NV Solar Energy Generation Profile.jpg 484 × 289; 33 KB
-
 2017 Solar Generation by State.jpg 484 × 400; 29 KB
-
 2017 TX Solar Energy Generation Profile.jpg 484 × 289; 31 KB
-
 2017 VT Solar Energy Generation Profile.jpg 484 × 289; 30 KB
-
 2017- Donald Trump veracity - composite graph.png 2,775 × 1,750; 141 KB
-
 2018 State Utility Solar Electric Generation.jpg 483 × 387; 30 KB
-
 2018 Top Ten States Biomass.jpg 483 × 292; 32 KB
-
 2018 Top Ten States Geothermal.jpg 483 × 292; 25 KB
-
 2018 Top Ten States Hydro.jpg 483 × 306; 27 KB
-
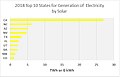 2018 Top Ten States Solar.jpg 483 × 309; 25 KB
-
 2018 Top Ten States Wind.jpg 483 × 302; 29 KB
-
%2C_variwide_chart.png/120px-2018_Worldwide_CO2_Emissions_(by_region%2C_per_capita)%2C_variwide_chart.png) 2018 Worldwide CO2 Emissions (by region, per capita), variwide chart.png 2,999 × 1,997; 720 KB
2018 Worldwide CO2 Emissions (by region, per capita), variwide chart.png 2,999 × 1,997; 720 KB
-
 2019 Wikipedia reader age by language.png 5,172 × 1,082; 239 KB
-
 2019 Wikipedia reader gender by language.png 2,232 × 476; 69 KB
-
.png/120px-2020_New_York_City_Property_Tax_(%24_in_millions).png) 2020 New York City Property Tax ($ in millions).png 600 × 371; 26 KB
2020 New York City Property Tax ($ in millions).png 600 × 371; 26 KB
-
 2020 U.S. Primary Energy Consumption Chart.png 1,334 × 920; 173 KB
-
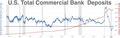 2023 banking crisis bank deposits.webp 3,763 × 1,189; 131 KB
-
 30 year fixed rate mortgage average in the United States.webp 4,160 × 1,846; 107 KB
-
 4 presentacion.jpg 1,542 × 1,156; 127 KB
-
.png/120px-4._Integrated_KM_Cycle_(Dalkir%2C_2011).png) 4. Integrated KM Cycle (Dalkir, 2011).png 655 × 488; 27 KB
4. Integrated KM Cycle (Dalkir, 2011).png 655 × 488; 27 KB
-
 65 Myr Climate Change.png 650 × 397; 21 KB
-

-

-
 ABIR profit graph.JPG 757 × 488; 39 KB
-
 Above-or-below-extreme-poverty-line-world-bank.png 3,400 × 3,423; 699 KB
-
 Absolute myocardial blood flow.png 387 × 227; 20 KB
-
.png/120px-Academic_works_by_discipline_over_time_(visualization_of_studies_data_in_OpenAlex).png) Academic works by discipline over time (visualization of studies data in OpenAlex).png 2,615 × 1,227; 292 KB
Academic works by discipline over time (visualization of studies data in OpenAlex).png 2,615 × 1,227; 292 KB
-
 Acc.GIF 384 × 330; 5 KB
-
 Accidental deaths 2004 in the United States.webp 4,495 × 1,256; 201 KB
-
 Accidental deaths 2020.webp 4,524 × 2,279; 221 KB
-
 Acigraph.png 560 × 420; 5 KB
-
 Acoustic room impulse response.jpeg 521 × 306; 16 KB
-
.png/120px-Active_Commons_users_over_time_according_to_Commons-Statistics_(any_action_within_last_30_days).png)
-
 Addedcapacityworld2009.jpg 1,450 × 884; 64 KB
-
 ADHD articles by year.PNG 1,040 × 321; 15 KB
-
 ADP private employment report.webp 4,207 × 1,700; 57 KB
-
 Adult Correctional Population - 1980-2007.png 953 × 542; 32 KB
-
 AEO 2012 Growth Projection for US Wind and Solar.png 1,200 × 360; 34 KB
-
 AEO 2013 Growth Projection for US Wind and Solar.png 1,200 × 360; 22 KB
-
 AEO 2013 Projection for US Wind and Solar-semilog.png 1,024 × 768; 34 KB
-
 Aerocapture-publications-histogram.png 1,539 × 831; 92 KB
-
 Afghanistan opium poppy cultivation 1994-2020.pdf 900 × 525; 24 KB
-
 Aflidollarar.png 1,317 × 630; 56 KB
-
.png/120px-Age_of_Wikipedia_readers_(18+_only).png) Age of Wikipedia readers (18+ only).png 1,200 × 800; 104 KB
Age of Wikipedia readers (18+ only).png 1,200 × 800; 104 KB
-
.png/120px-Age_of_Wikipedia_users_(2023_Wikipedia_survey).png) Age of Wikipedia users (2023 Wikipedia survey).png 1,756 × 1,436; 119 KB
Age of Wikipedia users (2023 Wikipedia survey).png 1,756 × 1,436; 119 KB
-
.jpg/120px-Age_structure_(Gender_equality_survey_on_the_Macedonian_Wikipedia).jpg)
-

-
_-_Romania.png/120px-Agriculture%2C_forestry%2C_and_fishing%2C_value_added_(%25_of_GDP)_-_Romania.png) Agriculture, forestry, and fishing, value added (% of GDP) - Romania.png 1,936 × 1,214; 127 KB
Agriculture, forestry, and fishing, value added (% of GDP) - Romania.png 1,936 × 1,214; 127 KB
-
 Agriculture-value-added-per-worker.png 3,400 × 2,825; 718 KB
-
 Airport Zurich statistics.png 1,555 × 865; 145 KB
-
 AK-Soviet partisans numbers.JPG 655 × 591; 46 KB
-
 Alabama electricity generation by type.webp 4,167 × 1,964; 337 KB
-
 Alabama Solar Power.webp 3,748 × 1,915; 70 KB
-
 Alaska electricity generation by type.webp 4,411 × 1,883; 329 KB
-
 Alcohol IQ Graph.jpg 800 × 600; 171 KB
-
 Alderfer’s ERG Theory.png 996 × 532; 22 KB
-
 All forcing agents CO2 equivalent concentration.png 1,500 × 1,200; 187 KB
-

-

-
 Amazon over time.png 1,192 × 784; 45 KB
-
 AmdahlsLaw.png 638 × 468; 49 KB
-
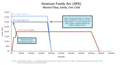 American Family Act CTC.png 4,202 × 2,291; 499 KB
-
 Amerindian population timeline.png 821 × 555; 31 KB
-
.png/120px-Amount_Granted_Over_Time_(%24M).png) Amount Granted Over Time ($M).png 600 × 371; 21 KB
Amount Granted Over Time ($M).png 600 × 371; 21 KB
-
 AMSRE Sea Ice Extent.png 720 × 450; 100 KB
-
_(8205558579).jpg/120px-An_Example_of_the_FDA_Decision_Making_Process_(FDA_118)_(8205558579).jpg) An Example of the FDA Decision Making Process (FDA 118) (8205558579).jpg 7,200 × 4,577; 20 MB
An Example of the FDA Decision Making Process (FDA 118) (8205558579).jpg 7,200 × 4,577; 20 MB
-
 Anbar Attacks.png 712 × 535; 513 KB
-
 ANKRD35 nasopharyngeal carcinoma.png 1,073 × 376; 10 KB
-
 Annual carbon primary production on land and in the ocean.jpg 1,074 × 1,280; 199 KB
-
.png/120px-Annual_greenhouse_gas_emissions_by_sector%2C_in_2010_(color).png) Annual greenhouse gas emissions by sector, in 2010 (color).png 1,500 × 1,200; 111 KB
Annual greenhouse gas emissions by sector, in 2010 (color).png 1,500 × 1,200; 111 KB
-
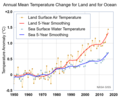 Annual Mean Temperature Change for Land and for Ocean NASA GISTEMP 2017 October.png 1,500 × 1,235; 297 KB
-
.PNG/120px-Annual_Park_Service_Visitors_(1916-2008).PNG) Annual Park Service Visitors (1916-2008).PNG 921 × 632; 21 KB
Annual Park Service Visitors (1916-2008).PNG 921 × 632; 21 KB
-
.png/120px-Annual_U.S._solar_photovoltaic_shipments_in_2010_through_2021_(52326961645).png)
-
 Annual US Wind Power Installation.png 800 × 600; 23 KB
-
 Annual-research-and-development-funding-for-technologies-infectious-diseases.png 3,400 × 2,400; 779 KB
-
 Anthropogenic changes in the global carbon cycle.png 2,067 × 1,250; 143 KB
-
 Anvia-Corporate-Structure.jpg 1,366 × 768; 121 KB
-

-
 App graph 001.png 522 × 353; 16 KB
-
 Apple Mac Worldwide Quarterly Sales.webp 4,171 × 1,702; 163 KB
-
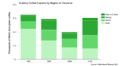 Arabica coffee output by region tanzania.png 1,079 × 597; 51 KB
-
 Arbcomduration.png 481 × 288; 15 KB
-
 Arch RDB.png 1,302 × 857; 253 KB
-
 Architecture CESAR.png 885 × 499; 67 KB
-
 Argentina Monetary Base Since Javier Milei Took Over.webp 3,637 × 1,295; 88 KB
-
 Argentina monetary base.webp 4,283 × 1,101; 63 KB
-
 Arizona electricity production by type.webp 4,350 × 1,977; 276 KB
-
 Arizona solar power.webp 3,658 × 1,448; 64 KB
-
 Arkansas electricity generation by type.webp 4,383 × 1,973; 378 KB
-
 Arkansas solar power.webp 4,010 × 1,357; 52 KB
-
 ARMs Indexes 1996-2006.png 375 × 395; 32 KB
-
 ARTL 구조.png 877 × 623; 28 KB
-
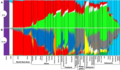
_--_Audience_viewership_of_TV_programs_in_Italy_(1987-).png/120px-Ascolti_TV_in_Italia_(1987-)_--_Audience_viewership_of_TV_programs_in_Italy_(1987-).png) Ascolti TV in Italia (1987-) -- Audience viewership of TV programs in Italy (1987-).png 8,429 × 6,187; 2.44 MB
Ascolti TV in Italia (1987-) -- Audience viewership of TV programs in Italy (1987-).png 8,429 × 6,187; 2.44 MB
-
 Attenuation plot wiki.tif 560 × 836; 1.34 MB
-
.png/40px-Auroville_population_by_communitiy_(2014).png) Auroville population by communitiy (2014).png 578 × 3,201; 164 KB
Auroville population by communitiy (2014).png 578 × 3,201; 164 KB
-
.png/40px-Auroville_population_by_fonction_(2014).png) Auroville population by fonction (2014).png 592 × 3,196; 180 KB
Auroville population by fonction (2014).png 592 × 3,196; 180 KB
-
.png/60px-Auroville_population_by_nationality_(2014).png) Auroville population by nationality (2014).png 529 × 1,272; 63 KB
Auroville population by nationality (2014).png 529 × 1,272; 63 KB
-
 Australia electricity generation by source.png 850 × 522; 83 KB
-
 Australian Analogue Channels.JPG 994 × 1,229; 293 KB
-
 Australian Digital Channel.JPG 992 × 1,228; 272 KB
-
 Australian feminists articles by language.png 1,382 × 909; 93 KB
-
 Austria electricity generation by source.png 850 × 522; 86 KB
-
 Autobiography-week27.png 432 × 308; 11 KB
-
 AV-TEST.org - MSE results on chart.png 1,224 × 803; 47 KB
-
 Available Energy-2.jpg 1,067 × 702; 84 KB
-
 Available Energy-3-es.png 1,067 × 702; 45 KB
-
 Available Energy-3.png 1,067 × 702; 50 KB
-
 Available Energy-4.png 1,067 × 702; 47 KB
-
 Average Construction Cost.png 900 × 800; 52 KB
-
 Average Interest Rate on U.S. Federal Debt.webp 4,501 × 1,602; 69 KB
-
 Average Length of Stay 2010 to 2011.JPG 479 × 288; 29 KB
-

-
 Average number of images in articles vs Wikipedia size.png 960 × 720; 98 KB
-
 Average Power of Pulsed Laser.jpg 2,333 × 1,750; 412 KB
-
 Average Residential Electricity Cost 2022.jpg 1,652 × 1,955; 346 KB
-
 Average type of delays based on certain factors.pdf 1,754 × 1,239; 163 KB
-
 Averaging example Crude averaging.png 2,672 × 1,367; 412 KB
-
 Avg-Rain-Uitnage.png 657 × 228; 33 KB
-
.png/120px-Avvenire_-_diffusione_media_in_confronto_(1976-).png) Avvenire - diffusione media in confronto (1976-).png 4,552 × 3,559; 936 KB
Avvenire - diffusione media in confronto (1976-).png 4,552 × 3,559; 936 KB
-
_b_.png/120px-B_Rhinegeist_Production_Growth_(Barrels_Year)_b_.png) B Rhinegeist Production Growth (Barrels Year) b .png 945 × 390; 49 KB
B Rhinegeist Production Growth (Barrels Year) b .png 945 × 390; 49 KB
-
 Backrooms Size Comparison.png 4,599 × 3,017; 575 KB
-
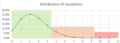
 Backtesting exceptions 10Dx250.png 464 × 237; 10 KB
-
 Backtesting exceptions 1Dx250.png 548 × 196; 10 KB
.png)
.png)
_Term_by_Tom_Bell.png)


.jpg)


.jpg)


,_variwide_chart.png)
.png)


.png)


.png)


.png)


.png)
.png)
.jpg)

_-_Romania.png)


.png)

_(8205558579).jpg)


.png)

.PNG)
.png)


_--_Audience_viewership_of_TV_programs_in_Italy_(1987-).png)
.png)


.png)
_b_.png)


.png)
.png)